Density dependence in killer whales
Eric J. Ward
2026-02-03
Source:vignettes/a5densitydependence.Rmd
a5densitydependence.RmdApproach
Over the decade from 2010-2020, there appeared to be a slowing of fecundity rates for both the SRKW and NRKW populations. We can examine correlations between those estimated fecundity rates, and aggregate population size.
Fecundity
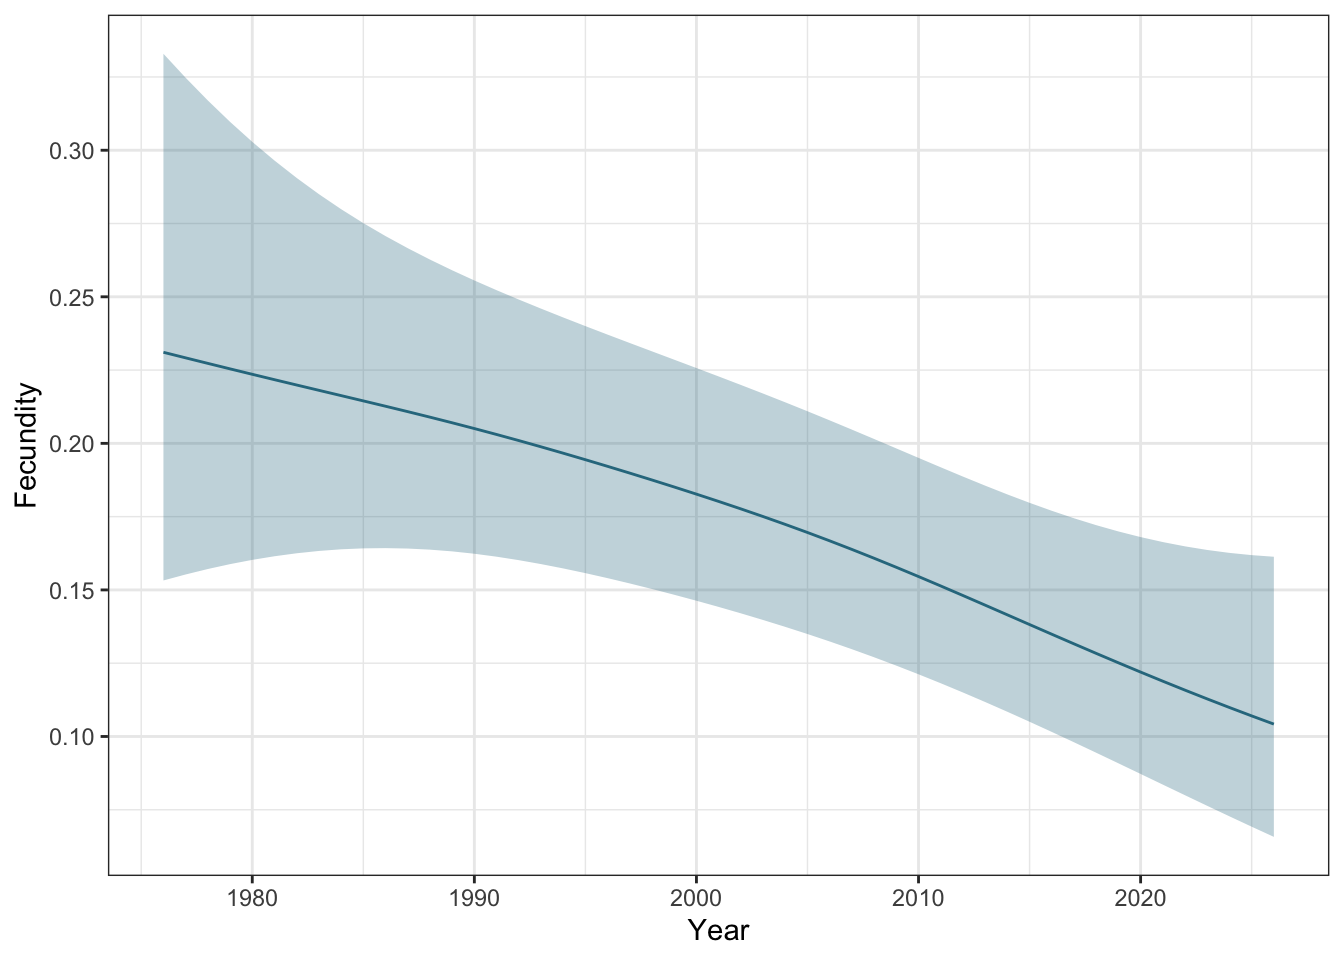
Figure 1: Estimated fecundity rates for 20-year females in the SRKW population. Ribbons represent 95% CIs.
There is not a clear relationship between declining fecundity rates and SRKW population size, because we see both high and low fecundity rates at low total SRKW population sizes.
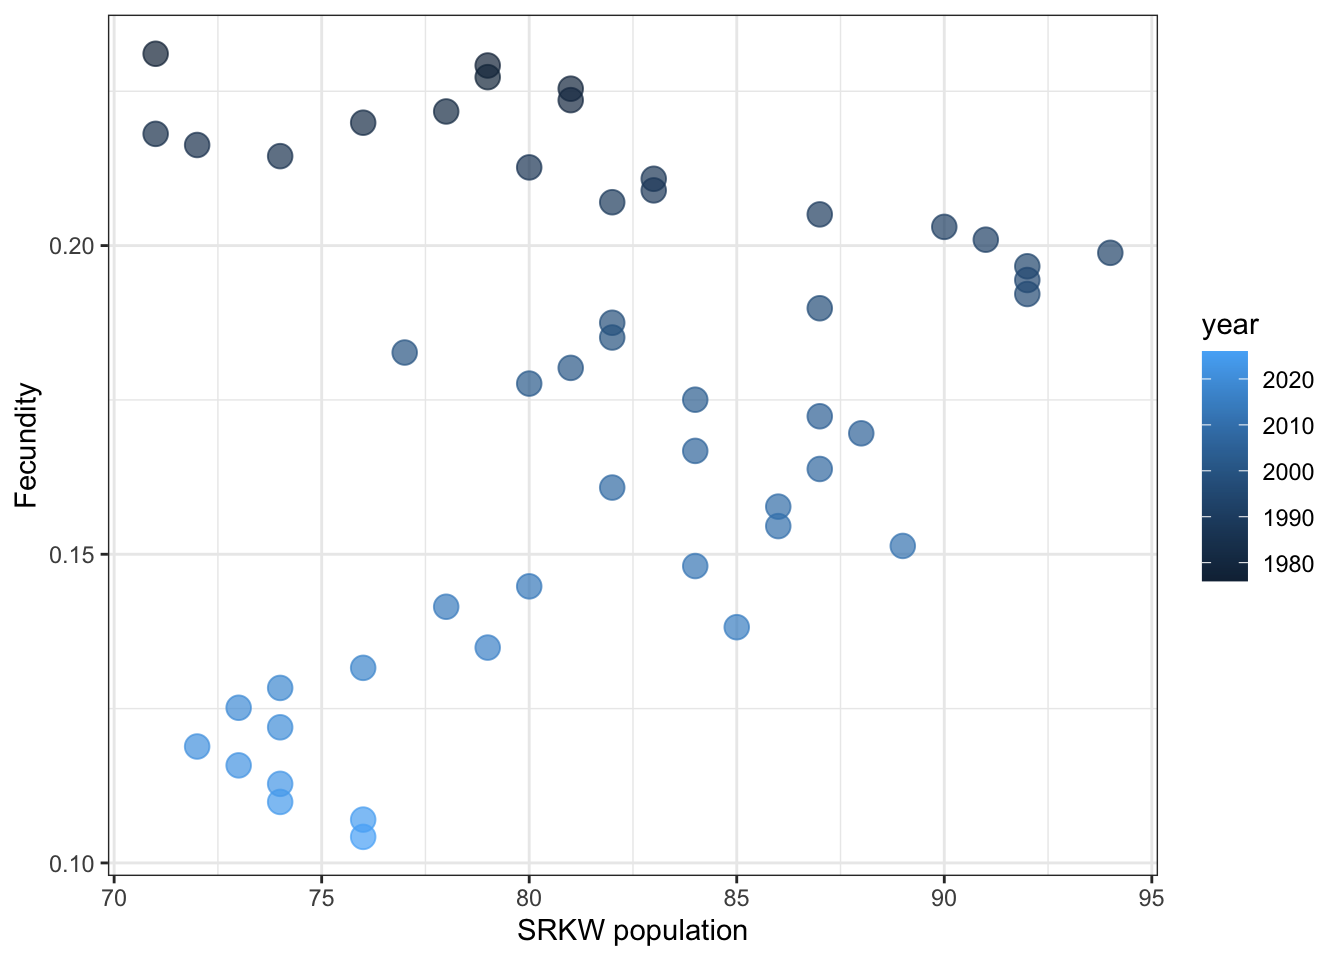
Figure 2: Estimated fecundity rates for 20-year females in the SRKW population versus total SRKW population size.
Given that fecundity rates for both populations are falling over the same period, a better proxy for density dependent effects may be the combined population sizes of SRKW and NRKW animals. This shows a clear declining relationship between fecundity rates and population size. The shape of the relationship is evidence of non-linear density dependence, and is similar to results seen in pinnipeds and large terrestrial mammals.
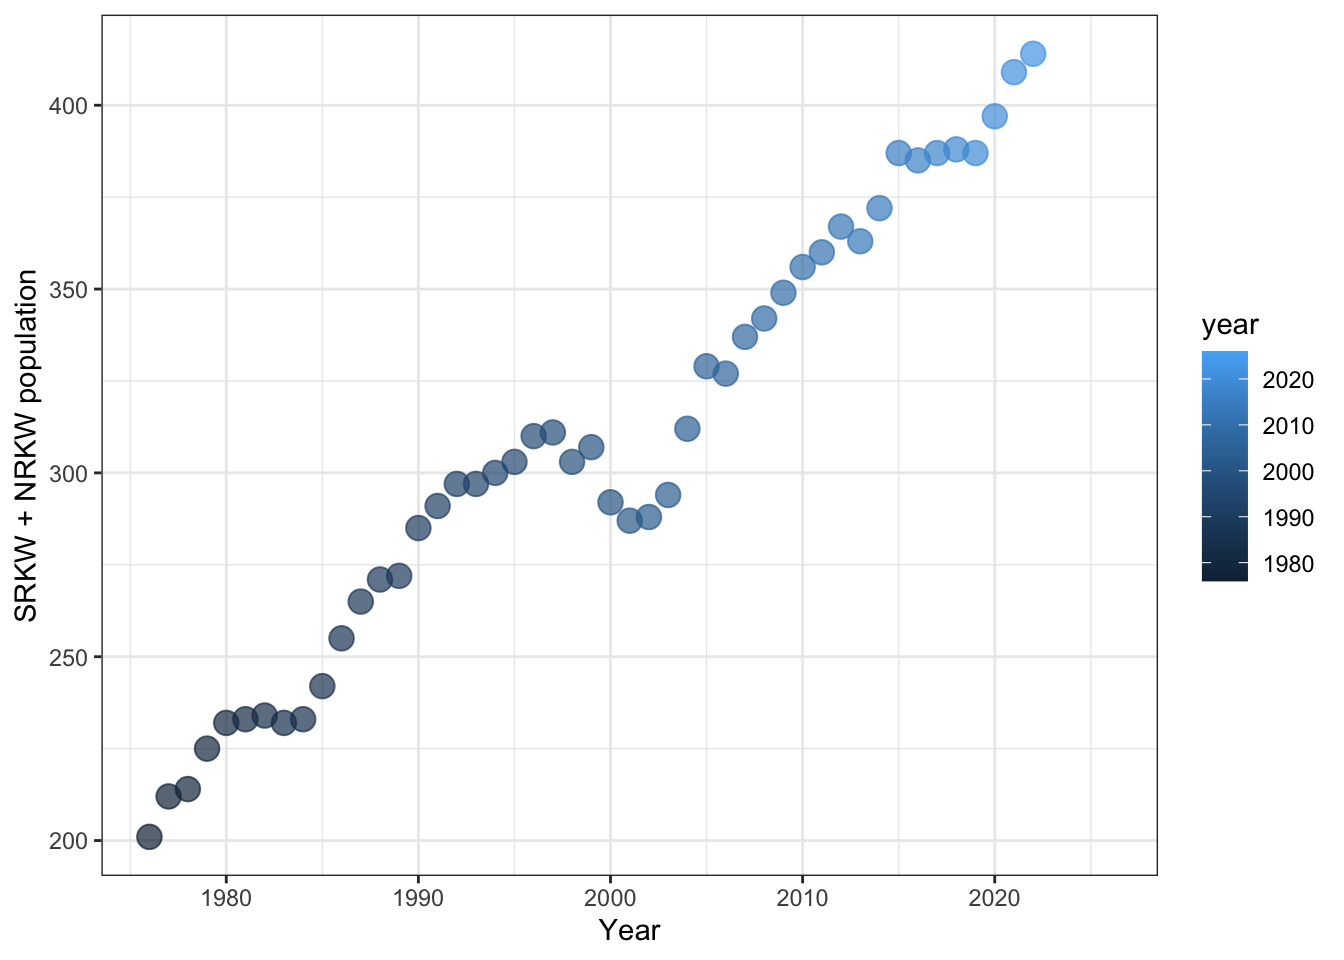
Figure 3: Combined time series of SRKW + NRKW populations
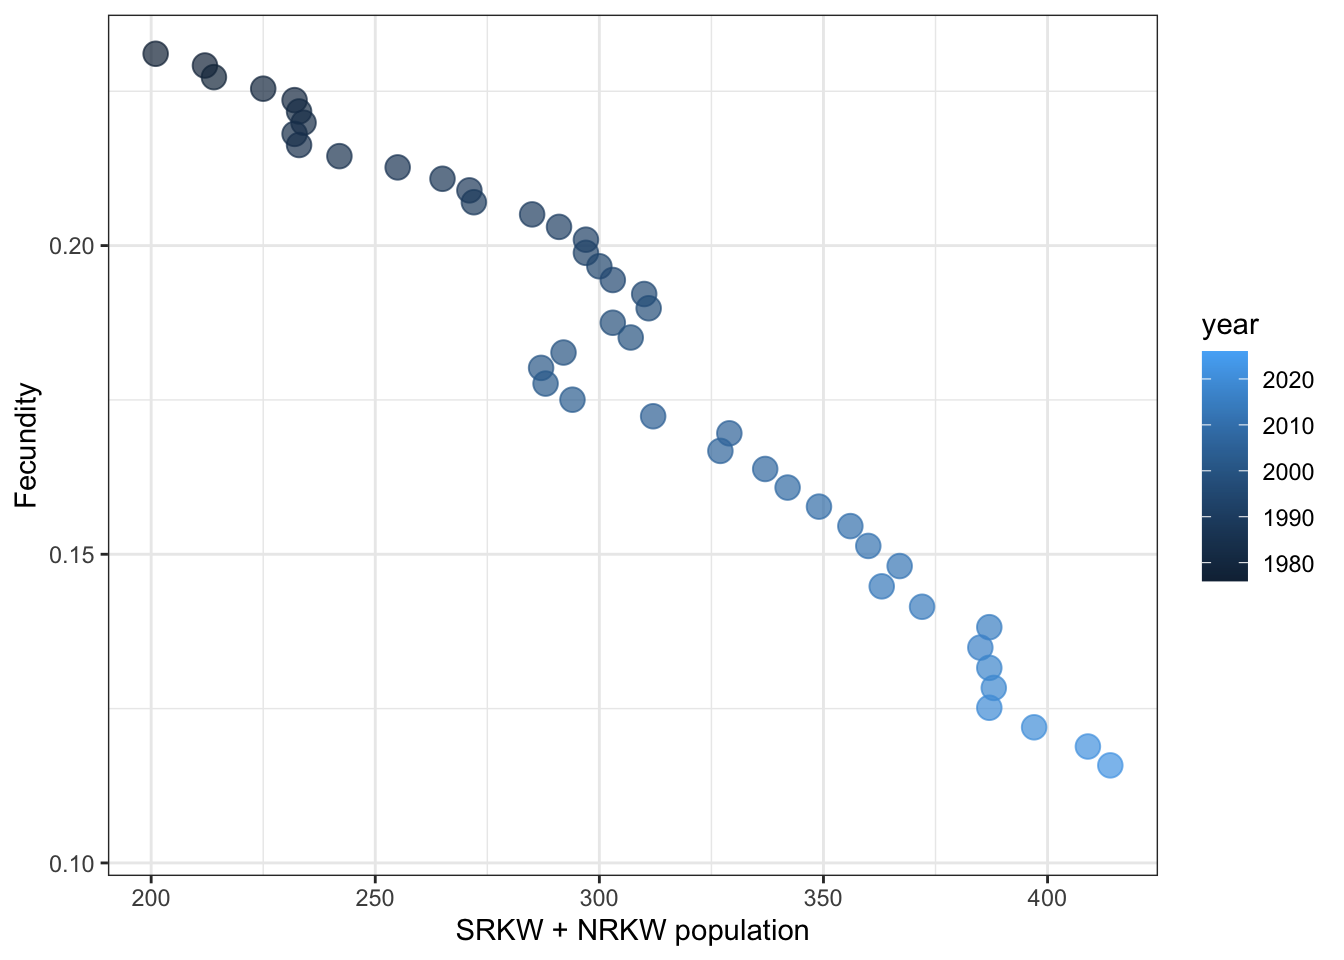
Figure 4: Estimated fecundity rates for 20-year females in the SRKW population versus combined (SRKW + NRKW) population size.