Executing a Model Run
To generate a full model run you will move through the tabs from left to right.
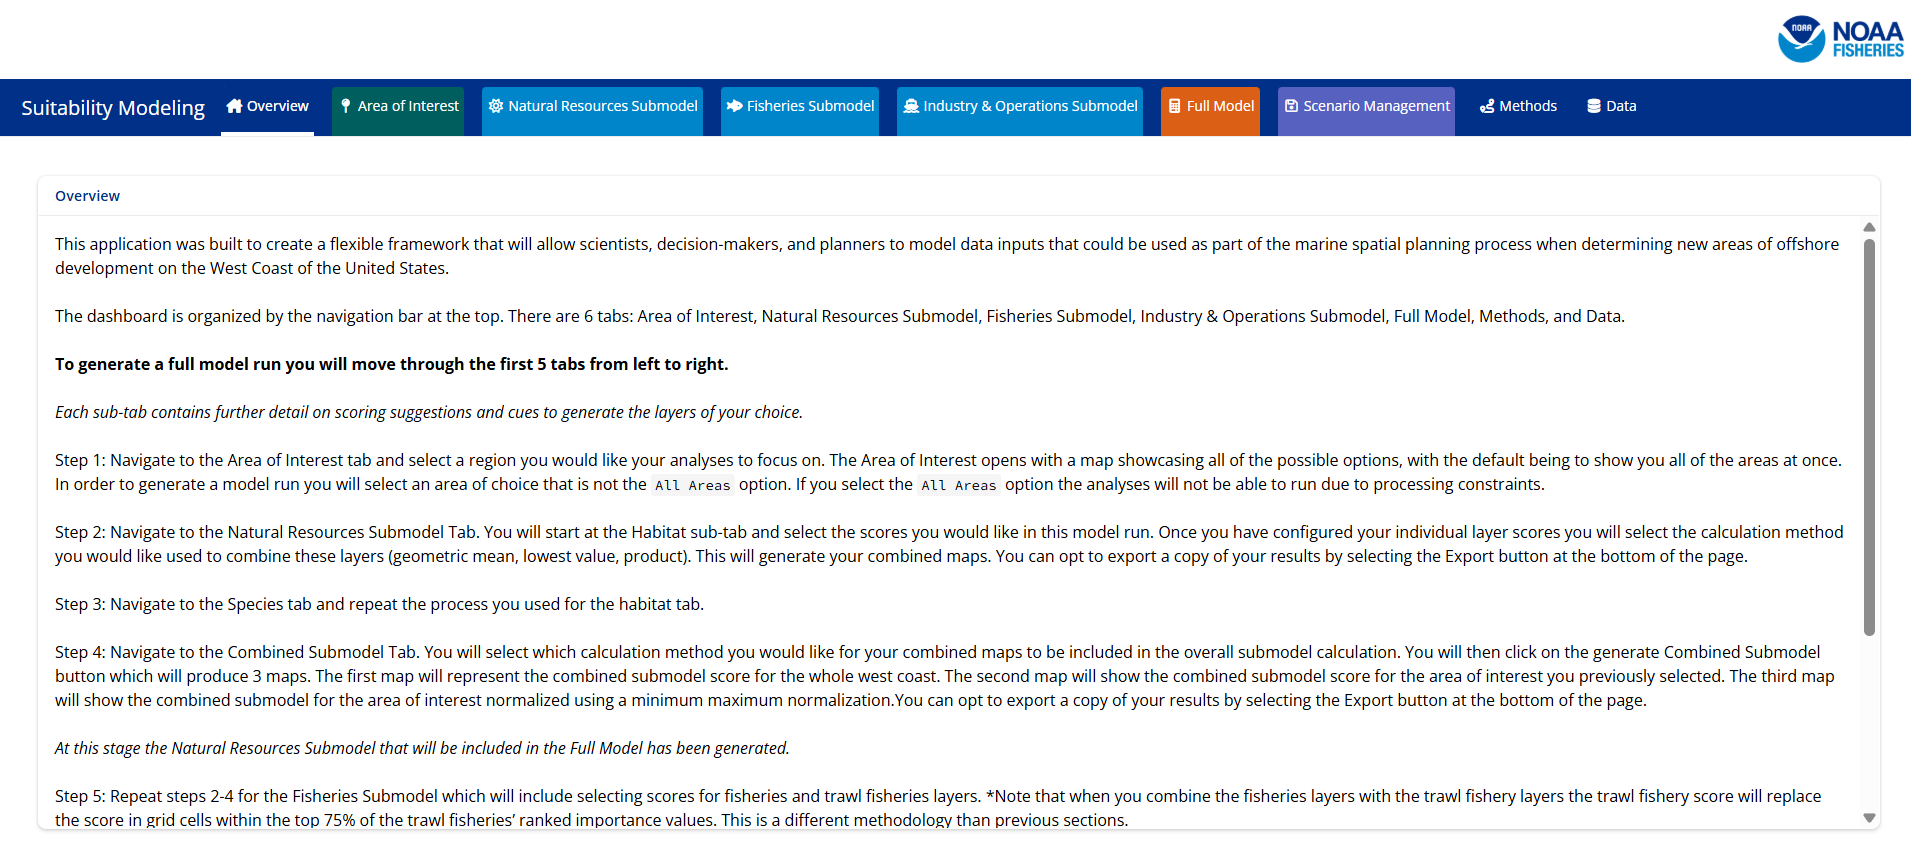
Each sub-tab contains further detail on scoring suggestions and cues to generate the layers of your choice.
Step 1: Select your area of interest
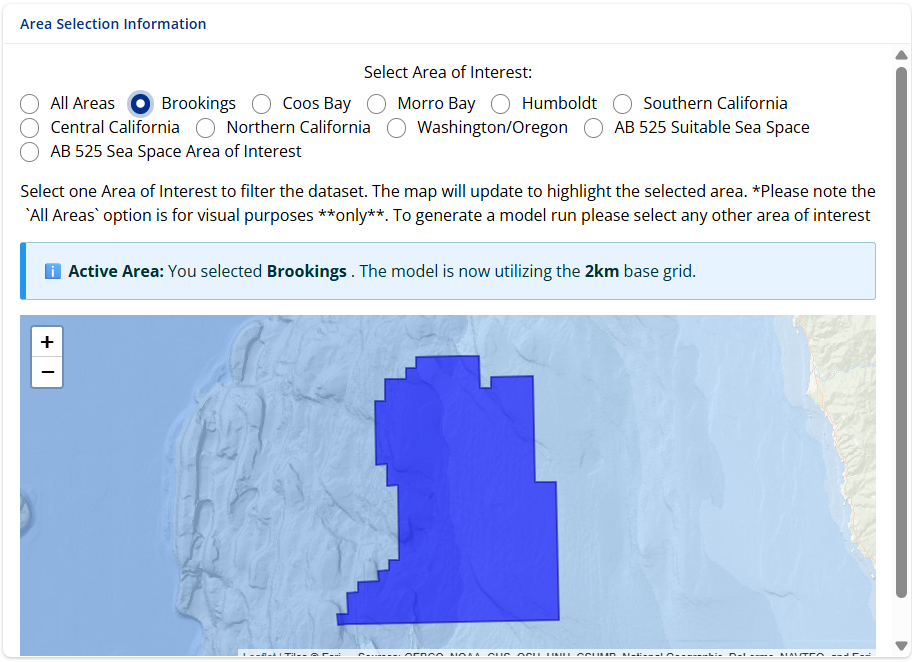
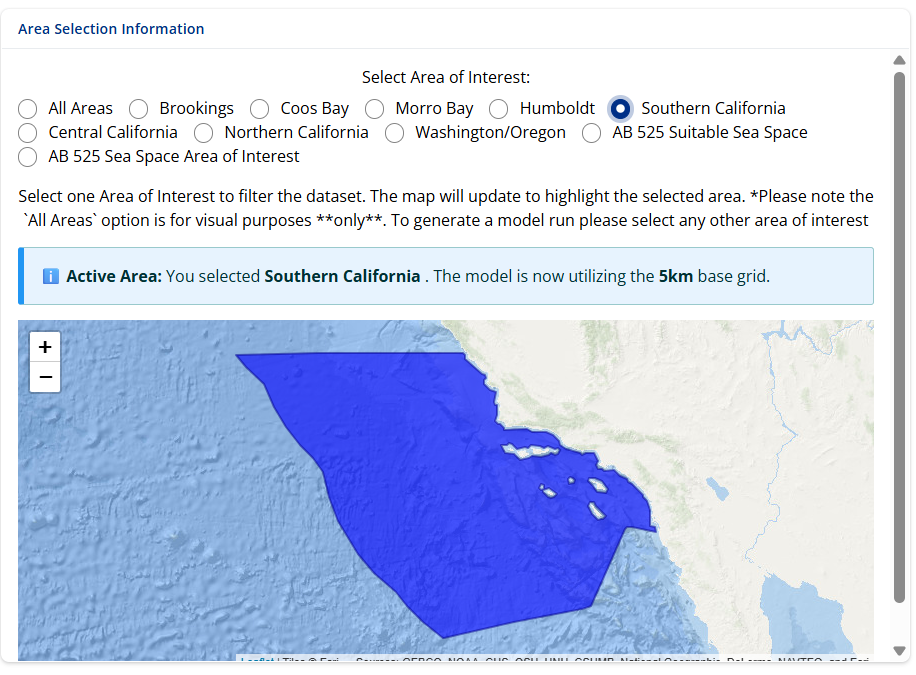
Navigate to the Area of Interest tab and select a region you would like your analyses to focus on. Geographically smaller areas (Wind Energy Areas, and CA Suitable Sea Space) will be loaded throughout the app using data processed with the 2km grid cell size. Geographically larger areas (OCS Planning Areas) will be loaded throughout the app using data processed with the 5km grid cell size. By selecting an area of interest, all maps generated in the application will be cropped to this area.
To select a different area of interest, you will click on the desired area’s button.
Step 2: Configure a component for a submodel (habitat used as an example)
Navigate to the Natural Resources Submodel Tab.
You will start at the Habitat sub-tab and select the scores you would like in this model run.
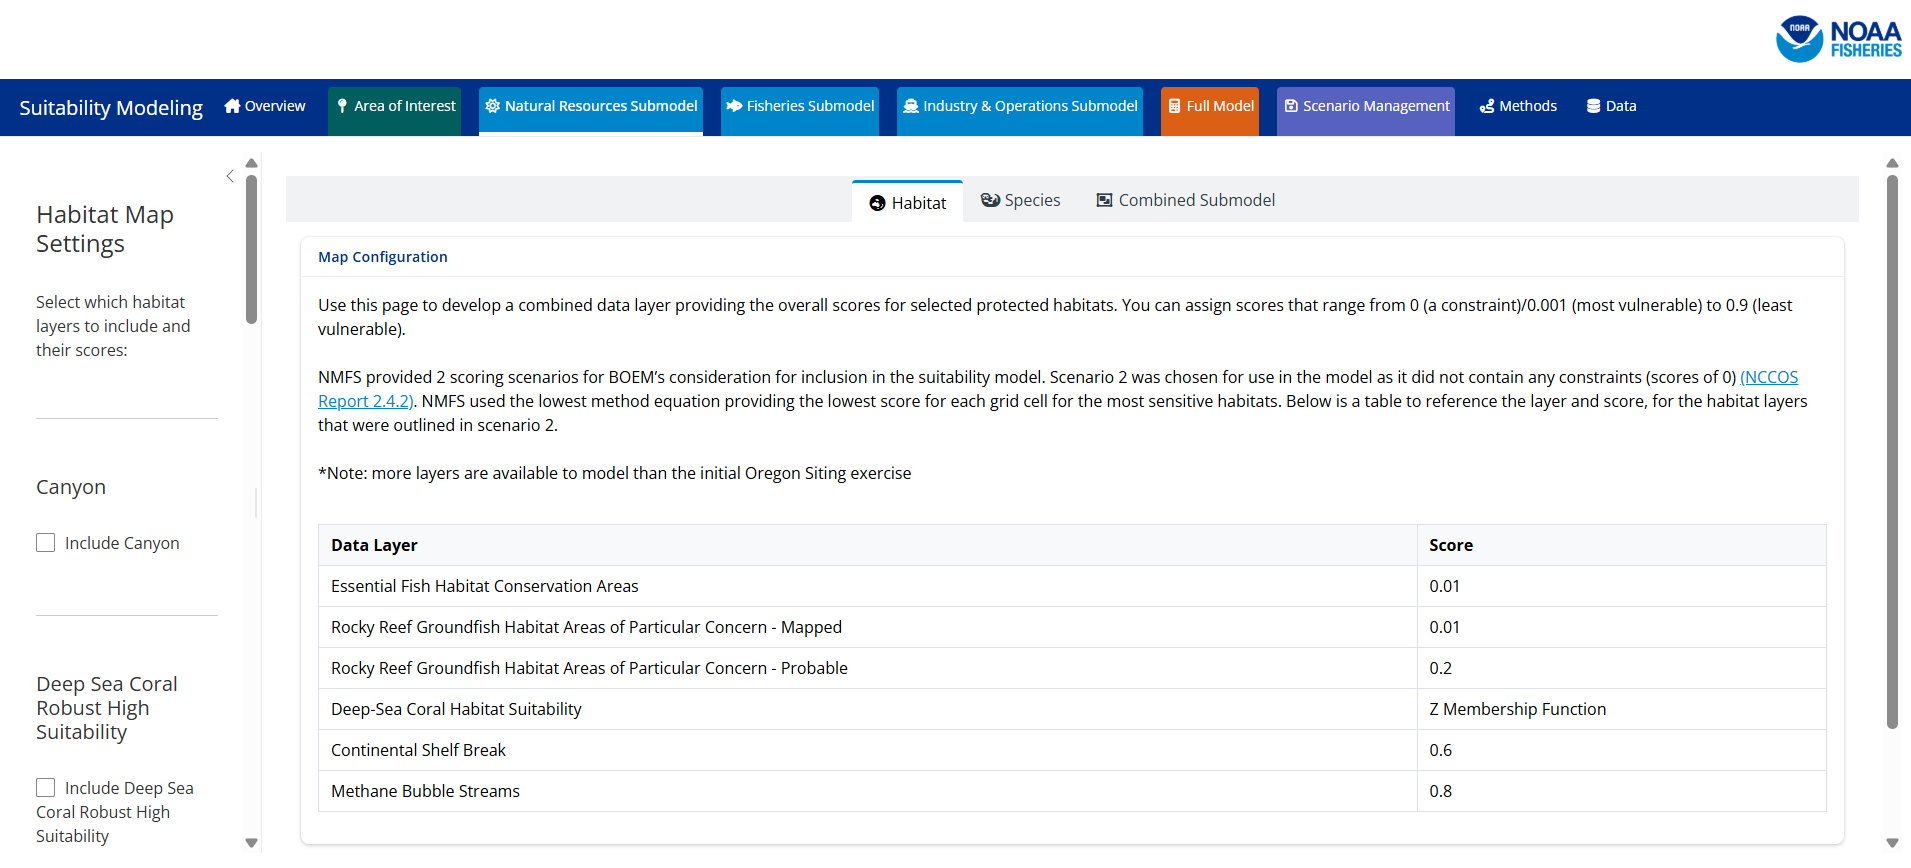
To select a score for a layer, you will first check the box next to the layer to initialize it. Once you have initialized the layer, you will select a score from the drop down menu.
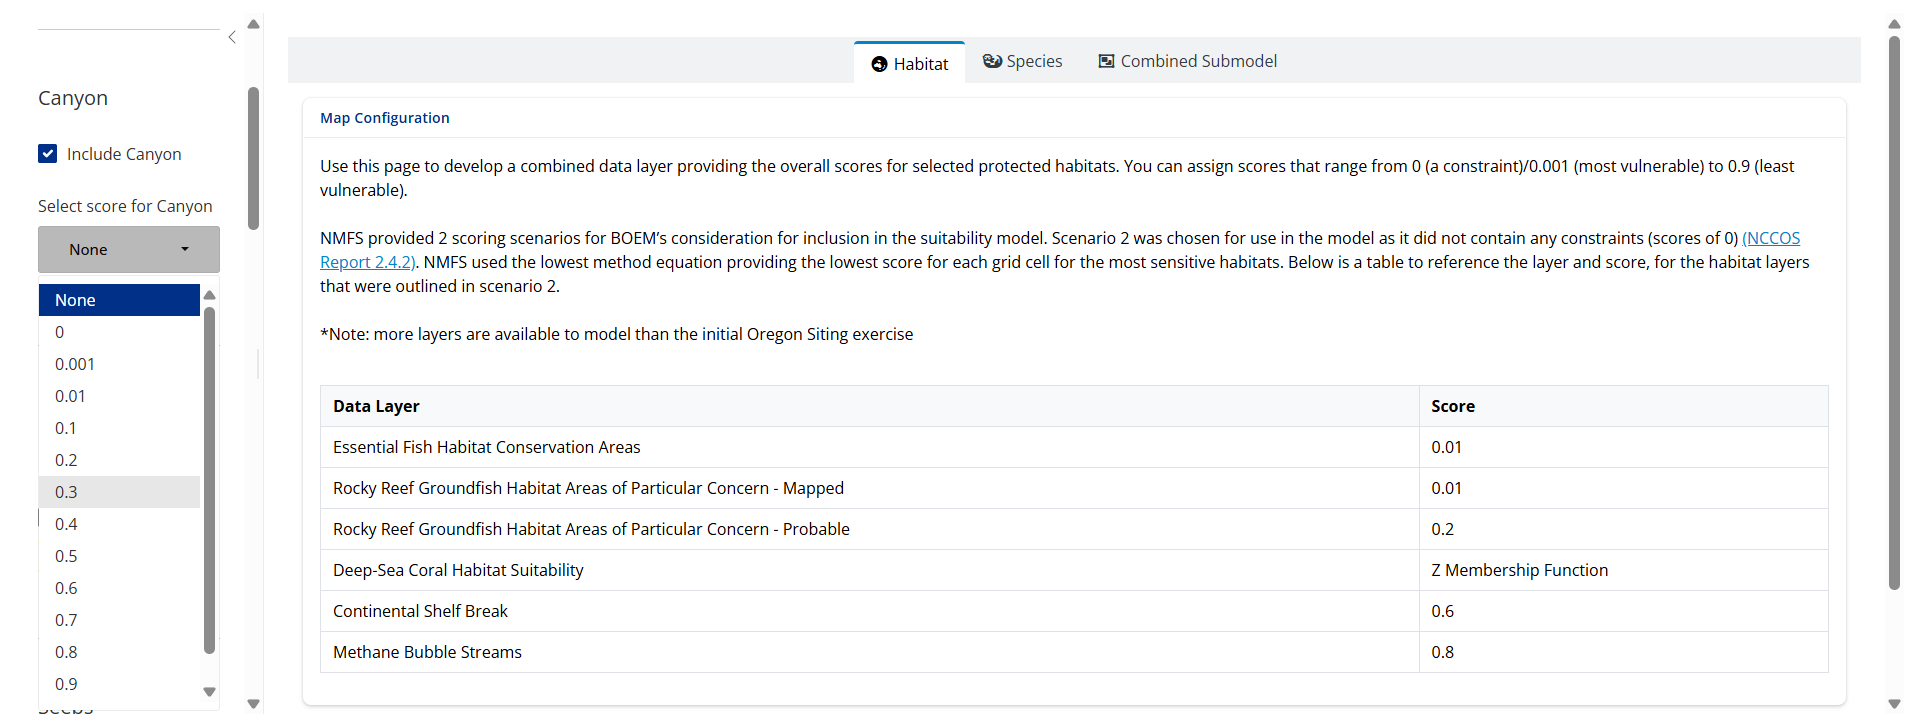
Scores typically range from 0 (exclude, very unsuitable) to 1 (most suitable). Some layers due to their structure will have alternative options such as the z-membership scores or a very limited option pool. If you have questions about which scores are represented on this app, please reference the methods section.
Once you have configured the data layers you are interested in including you will click the ‘Generate Habitat Maps’ button. Clicking this button will generate individual maps for each data layer you configured.
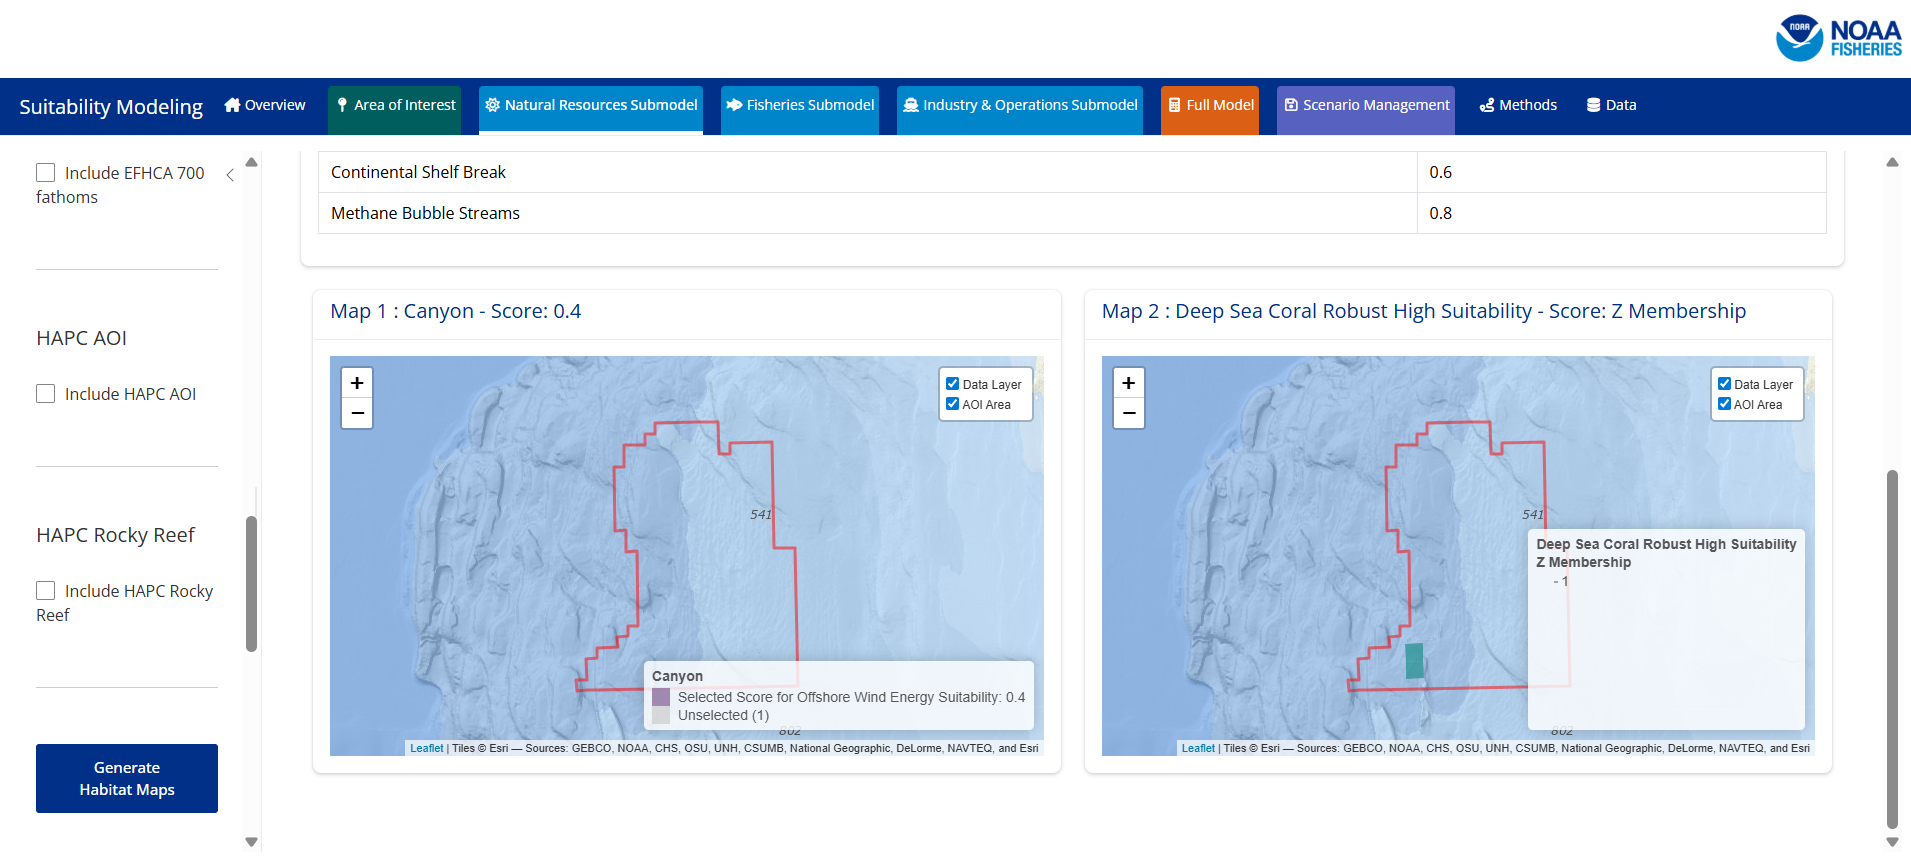
Each of these individual maps is dynamic. The maps can be zoomed in or zoomed out, and cells with scores are selectable to have a pop-up that details the score of the cell appear on the map. Additionally, you can move the area of focus by dragging the map.
*Note: if you initialized the layer but selected None for the score, the map will not generate
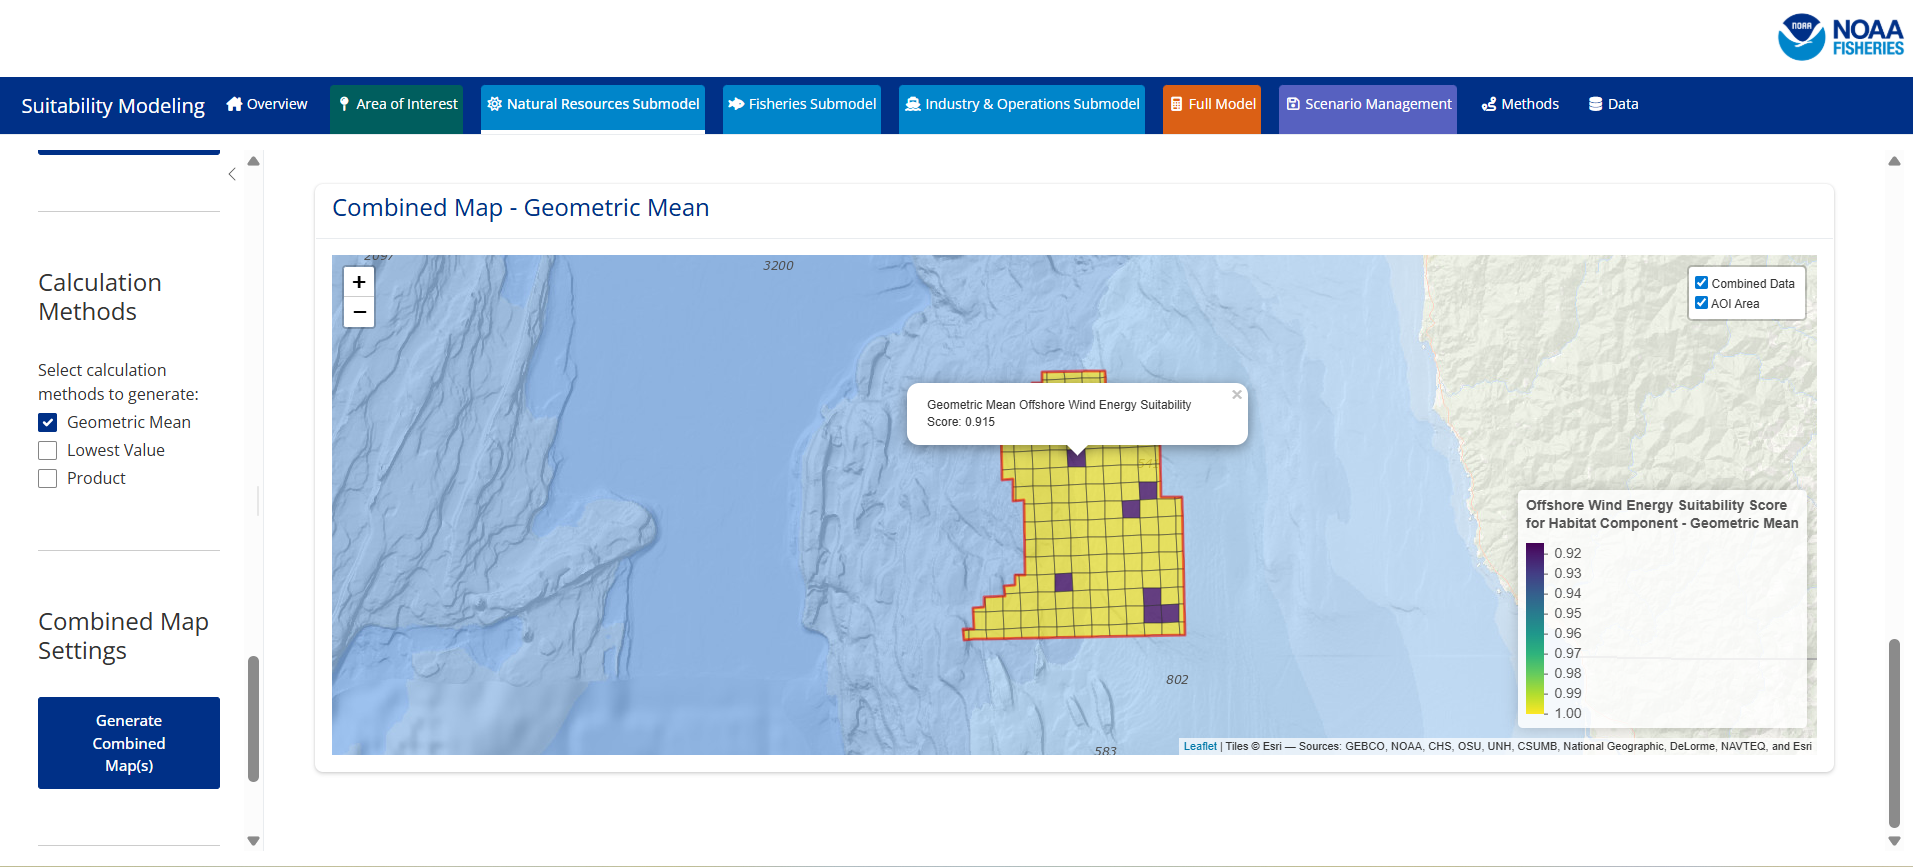
Once you have configured your individual layer scores you will select the calculation method you would like used to combine these layers (geometric mean, lowest value, product). You will then select the ‘Generate Combined Map(s)’ button. This will generate your combined maps.
You can opt to export a copy of your results by selecting the ‘Export Habitat Component Report’ button at the bottom of the page. When you select the button a loading screen will show on the app to indicate that the report is generating. When the report has completed generating it will be available in your downloads folder. A component report will include information about the data visualized, individual maps, and the combined maps selected. Here is an example of an individual component report.
Step 3: Configure a second component for a submodel (species used as an example)
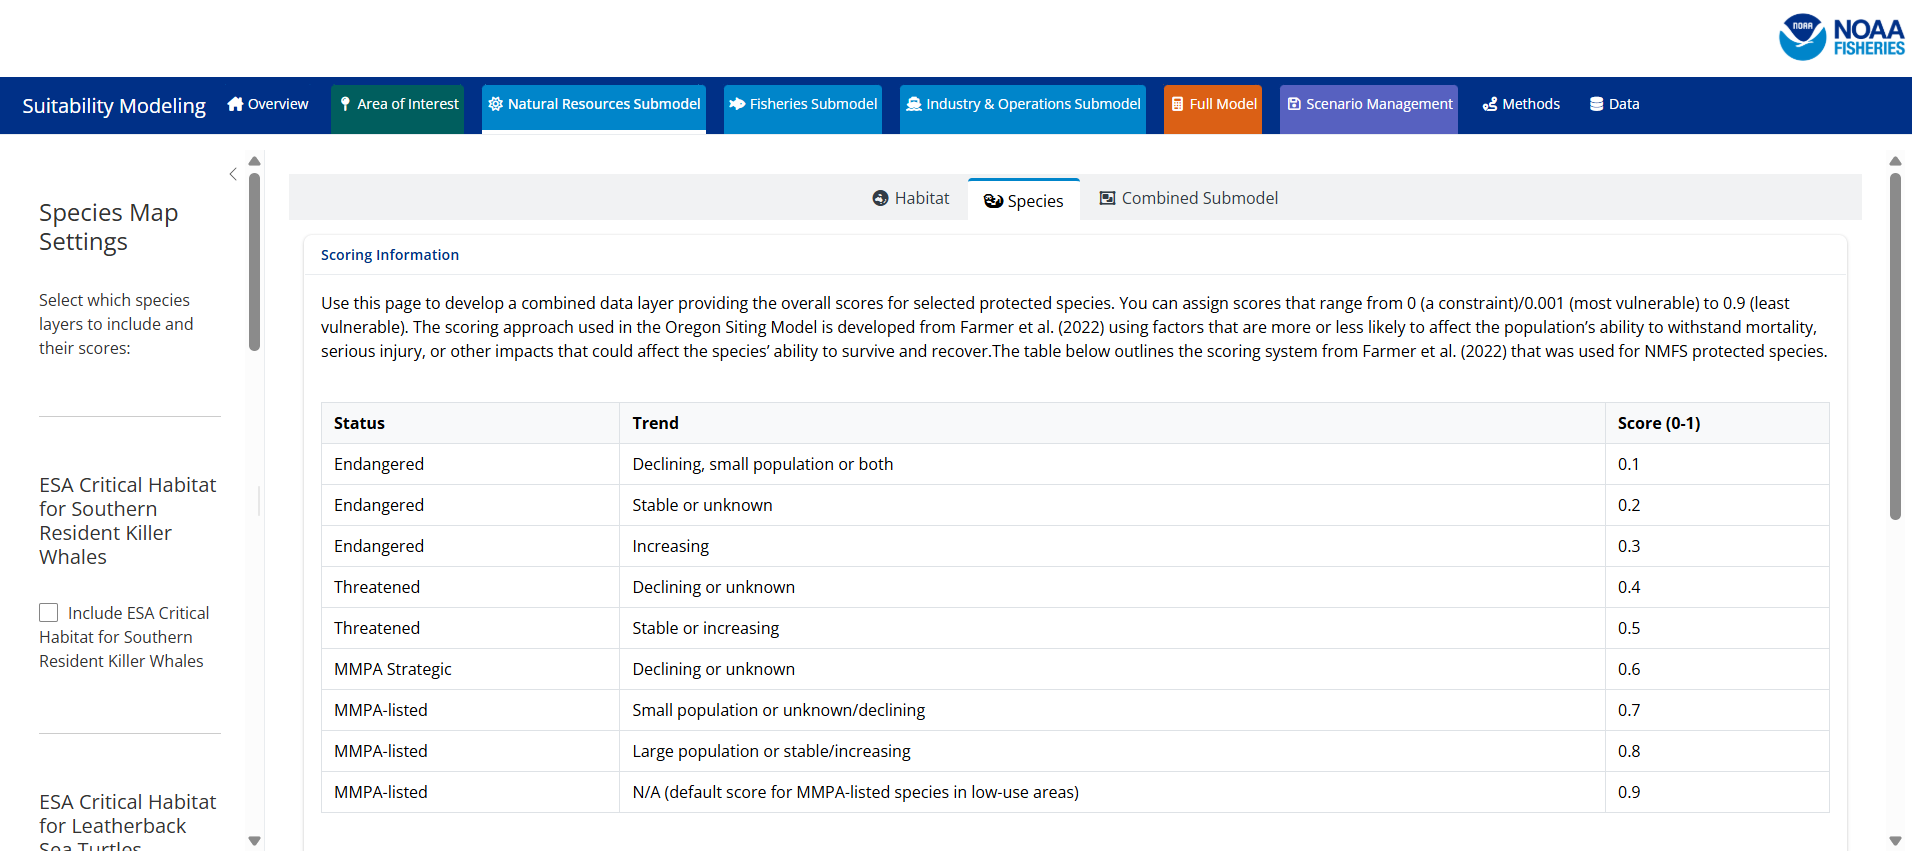
Navigate to the Species tab and repeat the process you used for the Habitat tab.
Step 4: Configure the natural resources submodel
Navigate to the Combined Submodel tab.
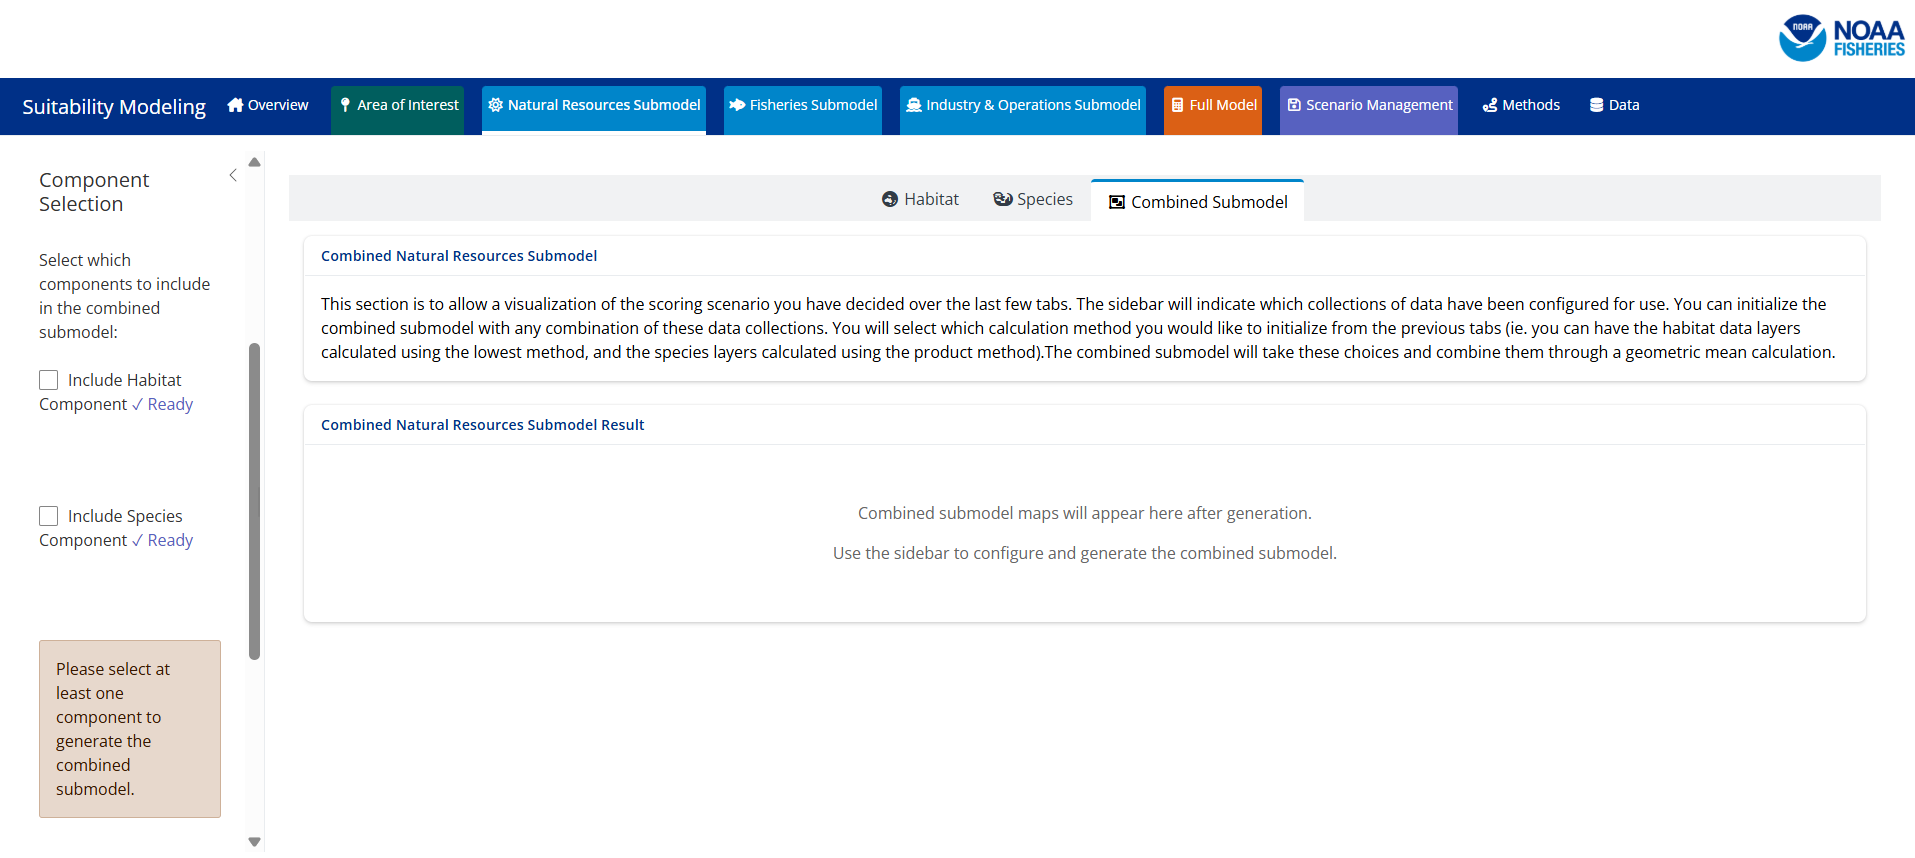
You will select which calculation method (geometric mean, product, or lowest) for each component should be used in the calculation to generate the combined submodel. The app will indicate which components have been configured for use in the combined submodel calculations.
*Note: If you choose to not configure a submodel’s components you will not be able to include this component in a combined map.
You will then click on the Generate Combined Submodel button, which will produce 2 maps.
The first map will represent the combined submodel score for the selected area of interest.
The second map will show the combined submodel score for the area of interest normalized using a minimum maximum normalization to emphasis score differences for visual inspection.
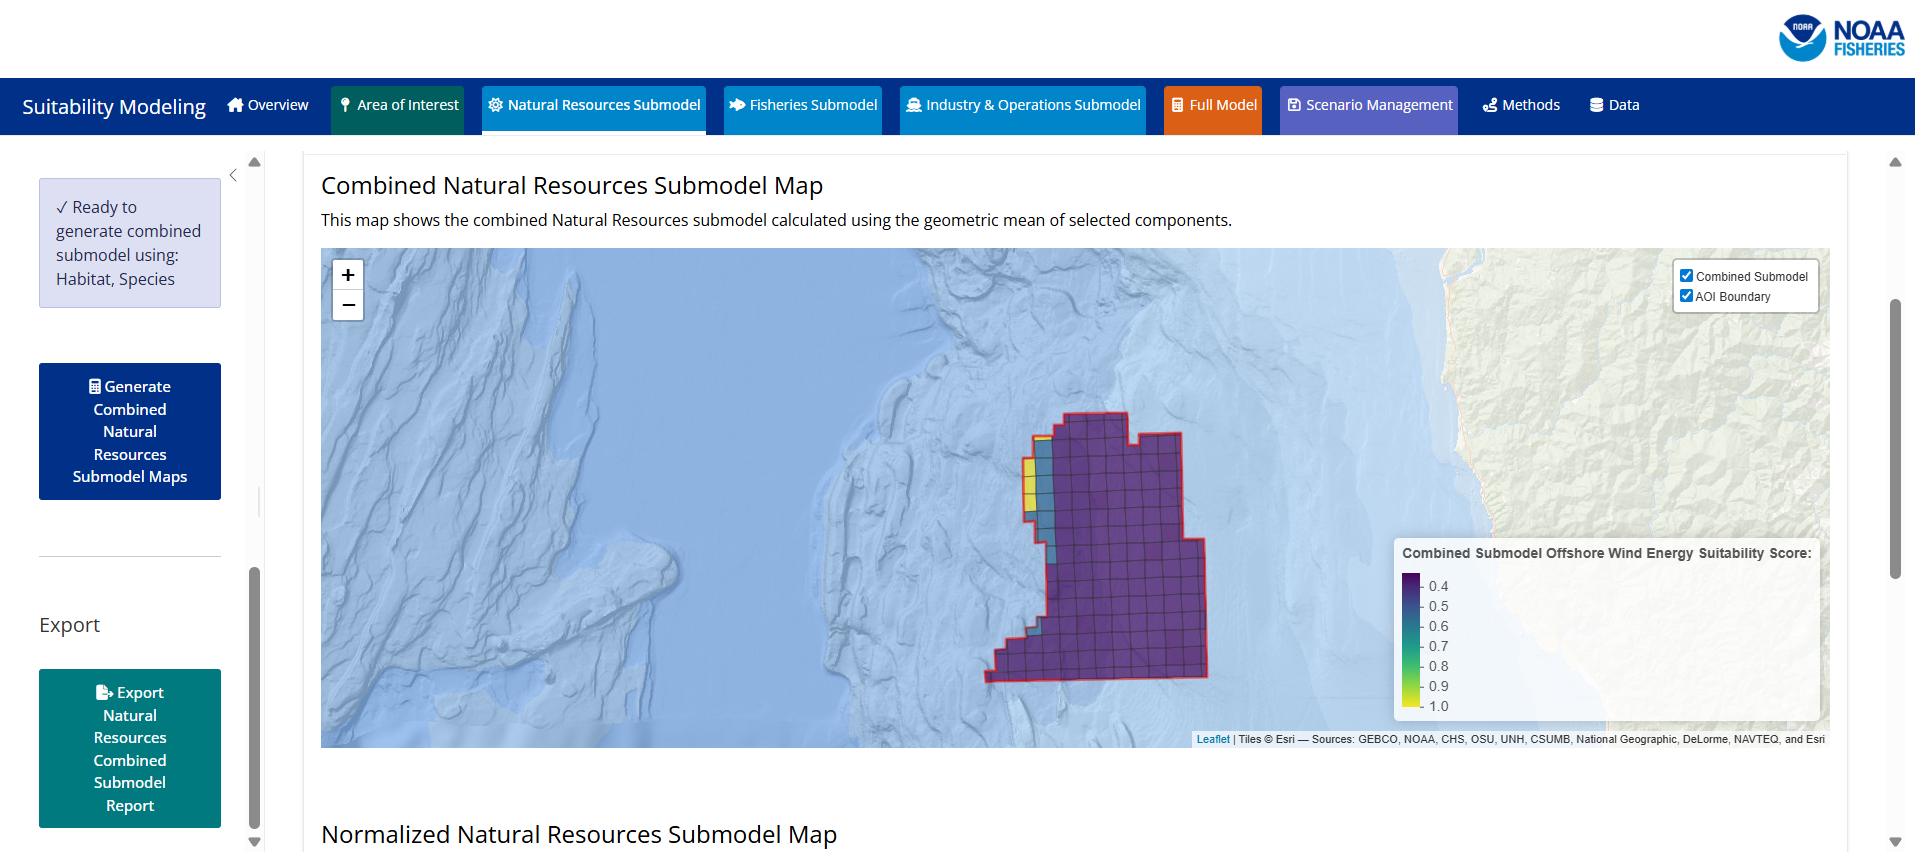
You can opt to export a copy of your results by selecting the ‘Export Natural Resources Combined Submodel Report’ button at the bottom of the page. When you select the button a loading screen will show on the app to indicate that the report is generating. When the report has completed generating it will be available in your downloads folder. A component report will include information about the data visualized, individual maps, and the combined maps selected. Here is an example of a combined submodel report.
At this stage the Natural Resources Submodel that will be included in the Full Model has been generated.
Step 5: Configure the fisheries submodel
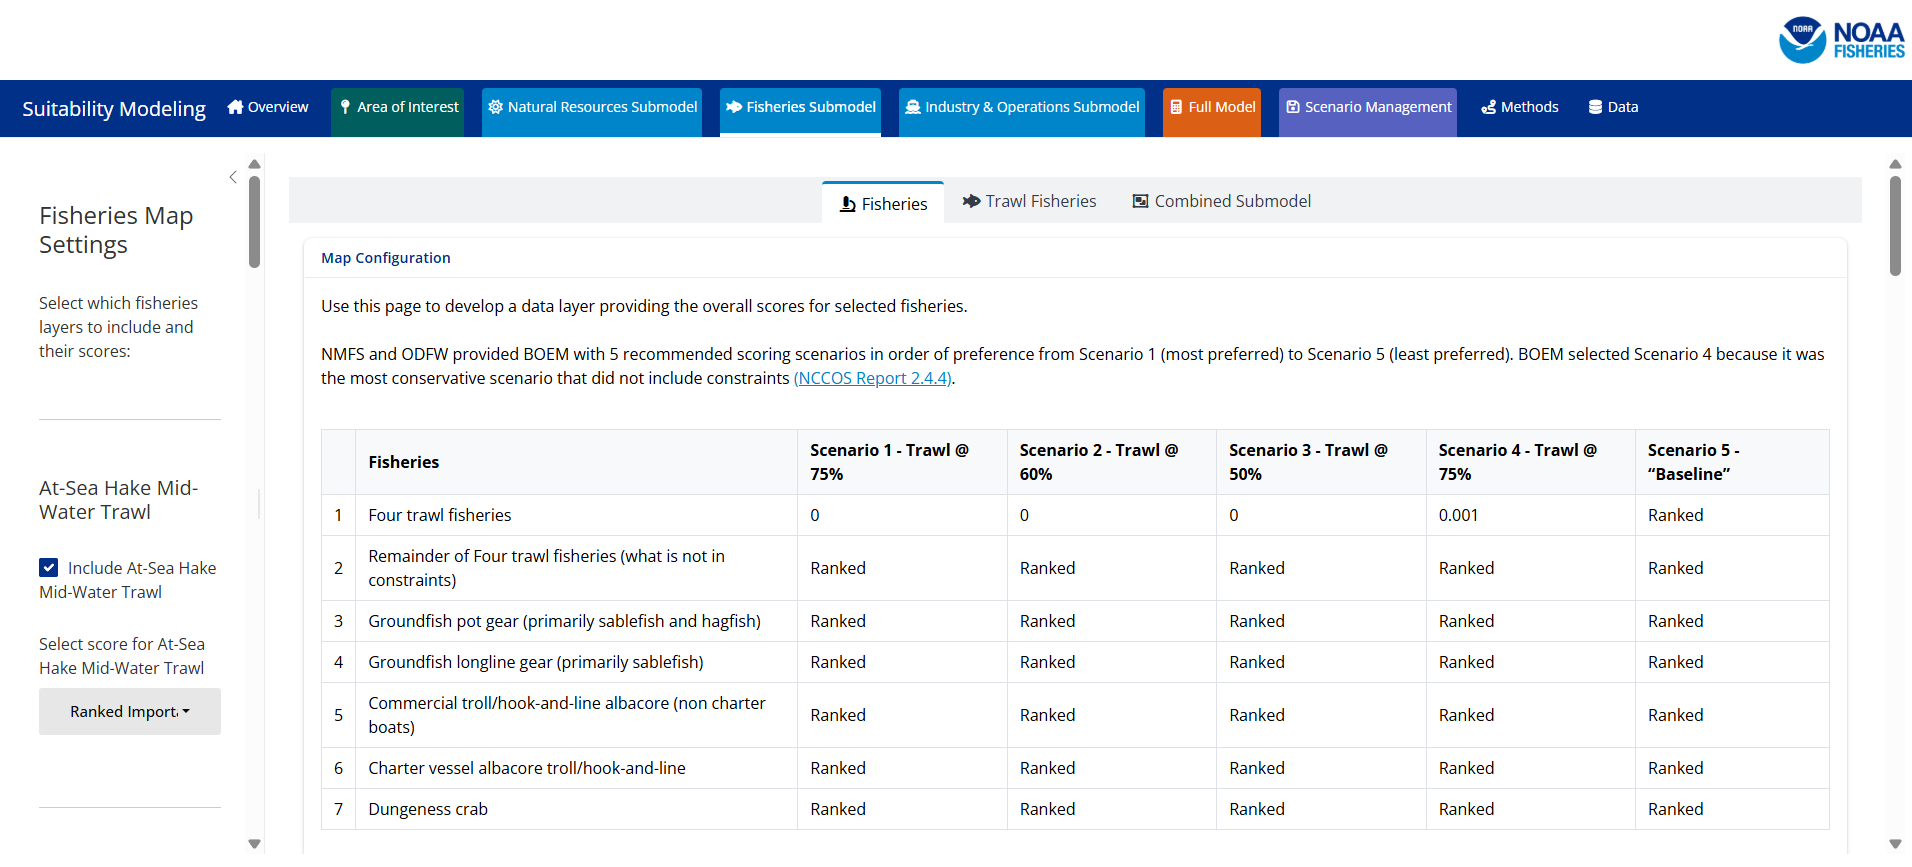
Repeat steps 2-4 for the Fisheries Submodel, which will include selecting scores for two components. The first component is fisheries.
The second component is trawl fisheries.
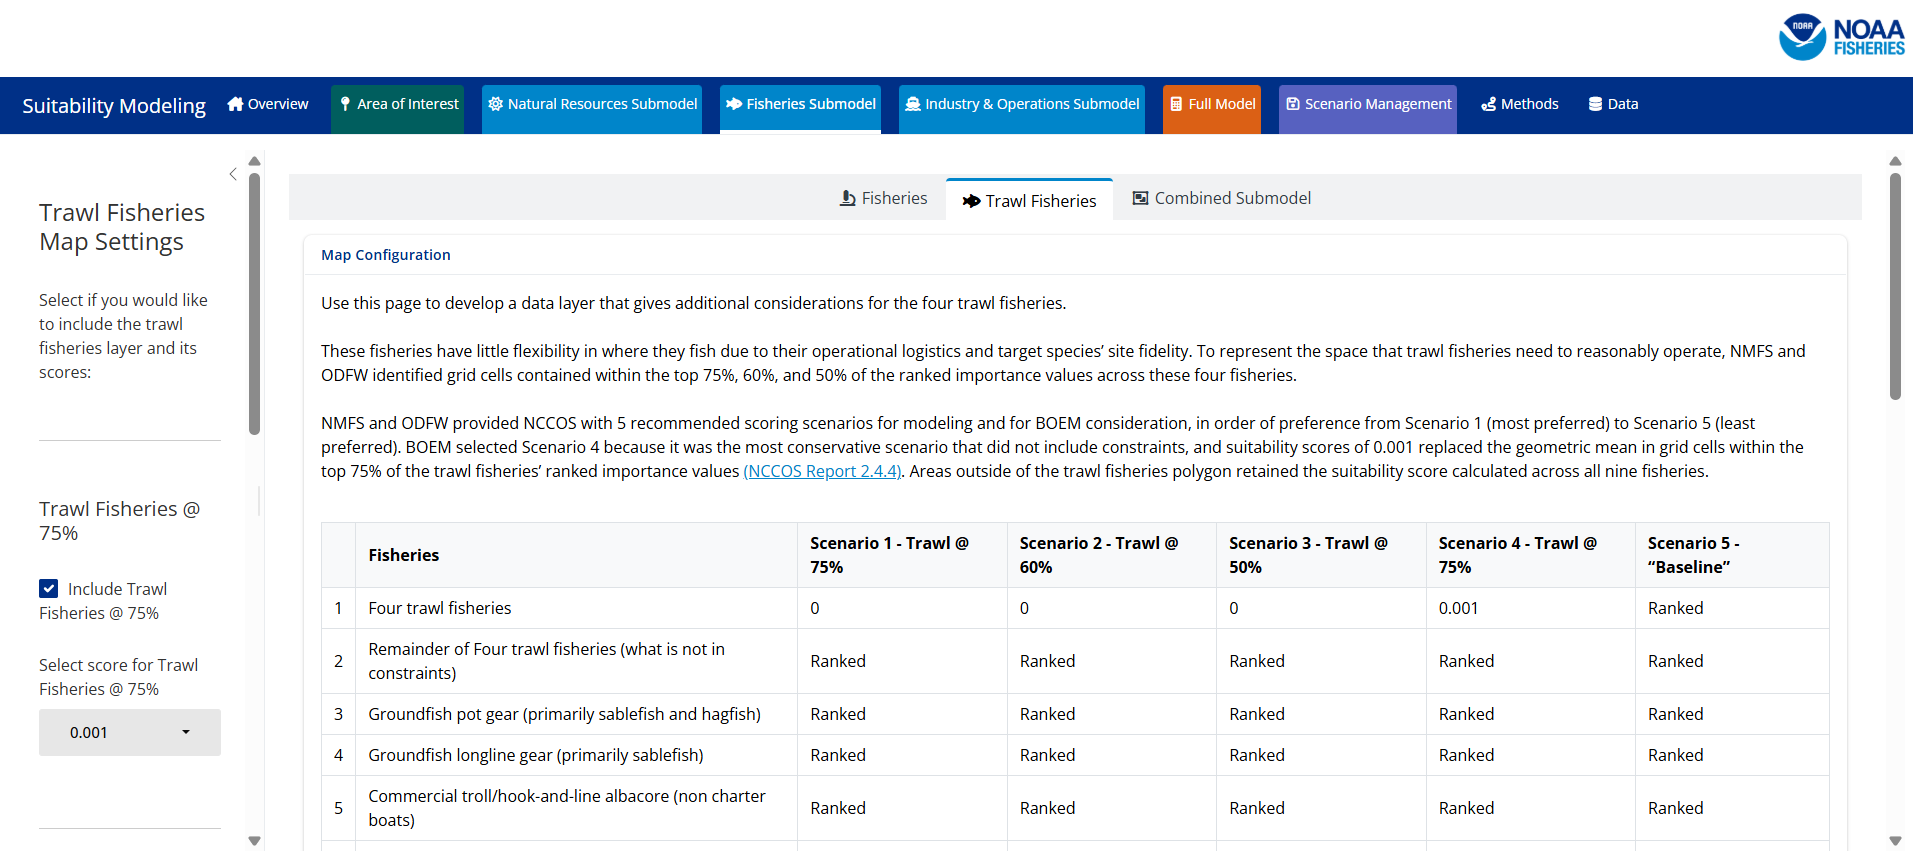
*Note that when you combine the fisheries layers with the trawl fishery layers the trawl fishery score will replace the score in grid cells within the top 75% of the trawl fisheries’ ranked importance values. This is a different methodology than previous sections.
At this stage the Fisheries Submodel that will be included in the Full Model will be generated.
Step 6: Configure the industry and operations submodel
Repeat steps 2-4 for the Industry & Operations Submodel. The Industry & Operations Submodel is comprised of two components. The first component is scientific surveys.
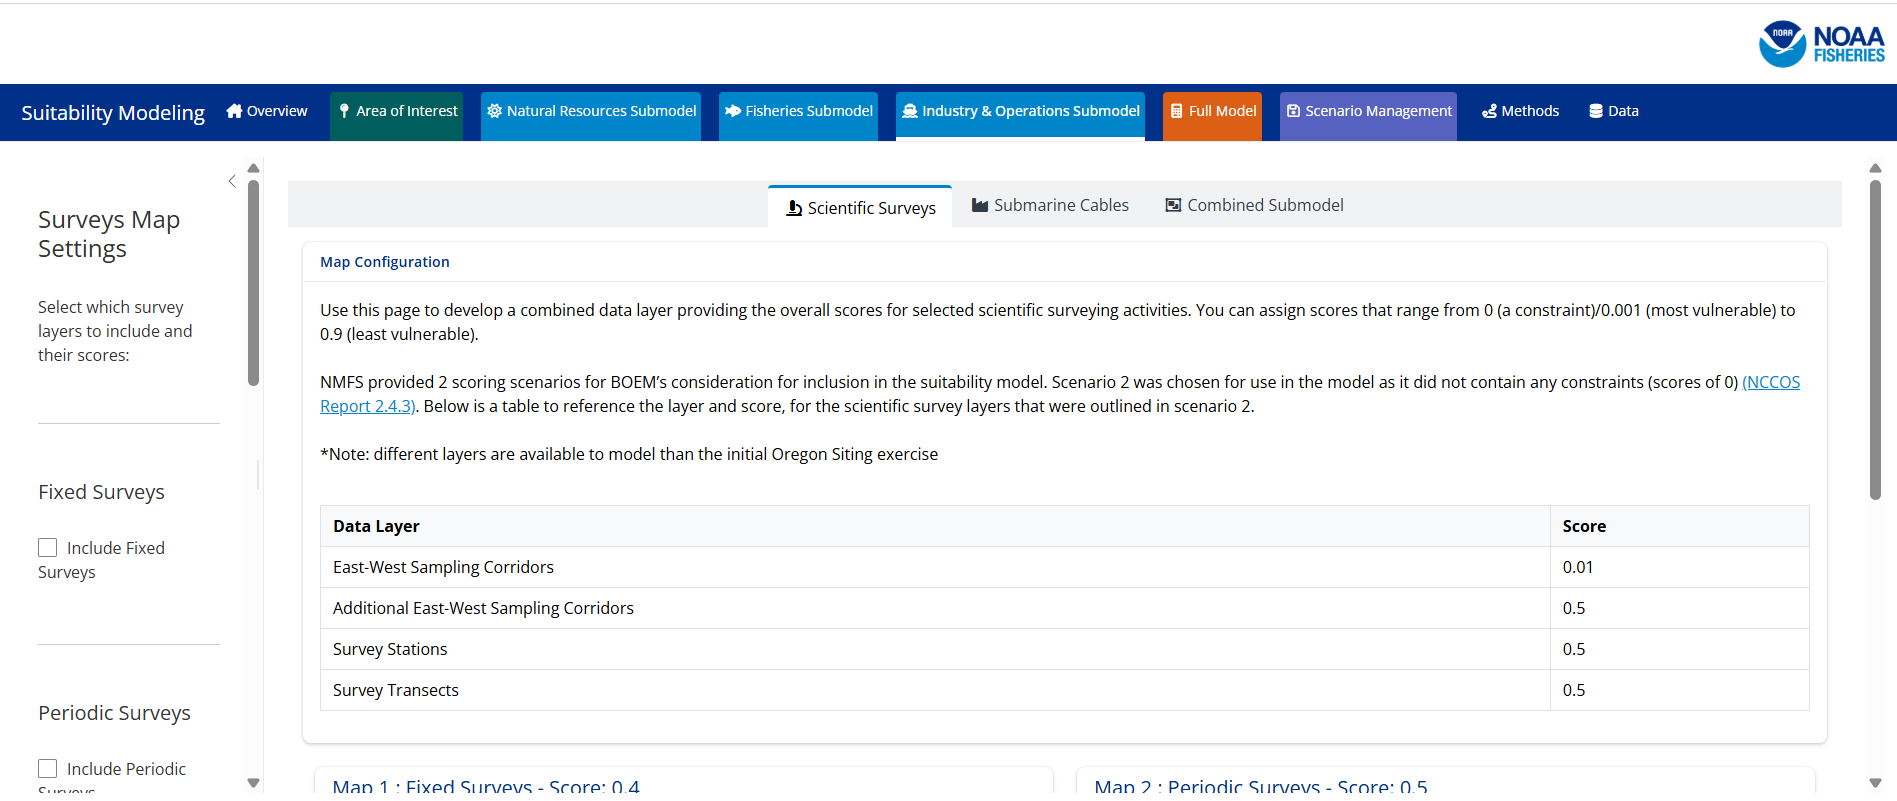
The second component is submarine cable lines.
At this stage the Industry & Operations Submodel that will be included in the Full Model has been generated.
Step 7: Configure and visualize a full model run
Navigate to the Full Model Tab.
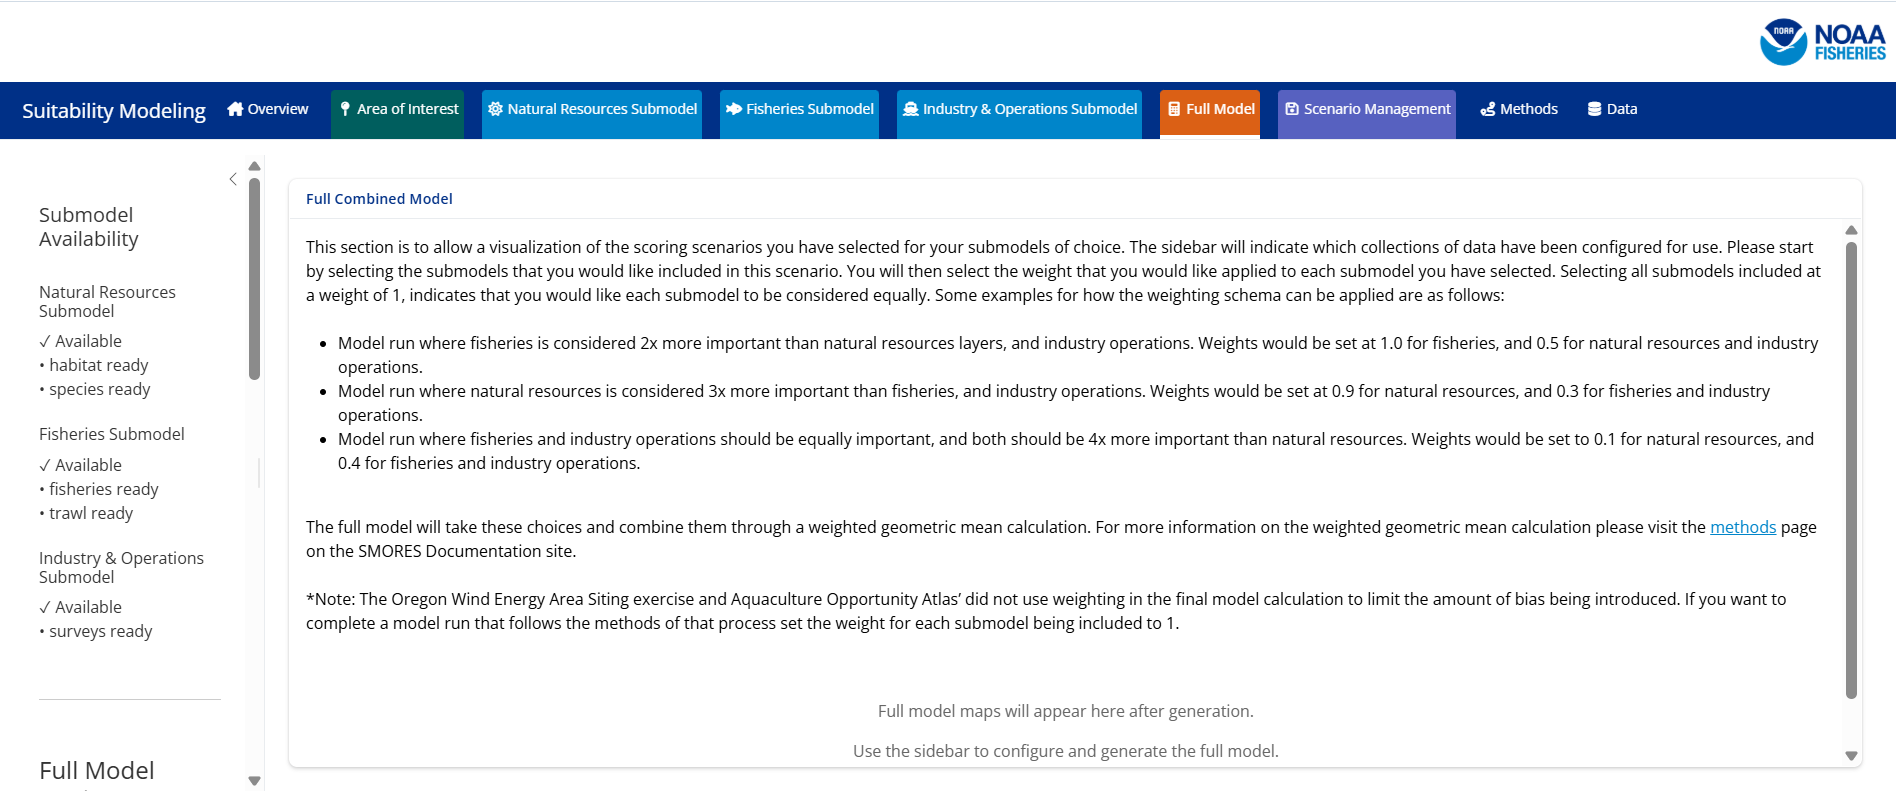
The sidebar on the left-hand side includes messaging indicating which submodels have been configured within the app and are available to be included in the full model calculation. If a submodel is not selected it will not be included in the full model calculation. Once you have selected the submodels you would like included, by selecting the check-box next to the submodel, you have the option to select a submodel weight to be applied to that submodel. A weight of 1 for all submodels will apply a non-weighted geometric mean in order to calculate the final full model. Model weights not equal to 1 will apply a weighted geometric mean calculation to calculate the final full model. Weights are available in 0.1 increments. For more information on weighting please see the Methods page.
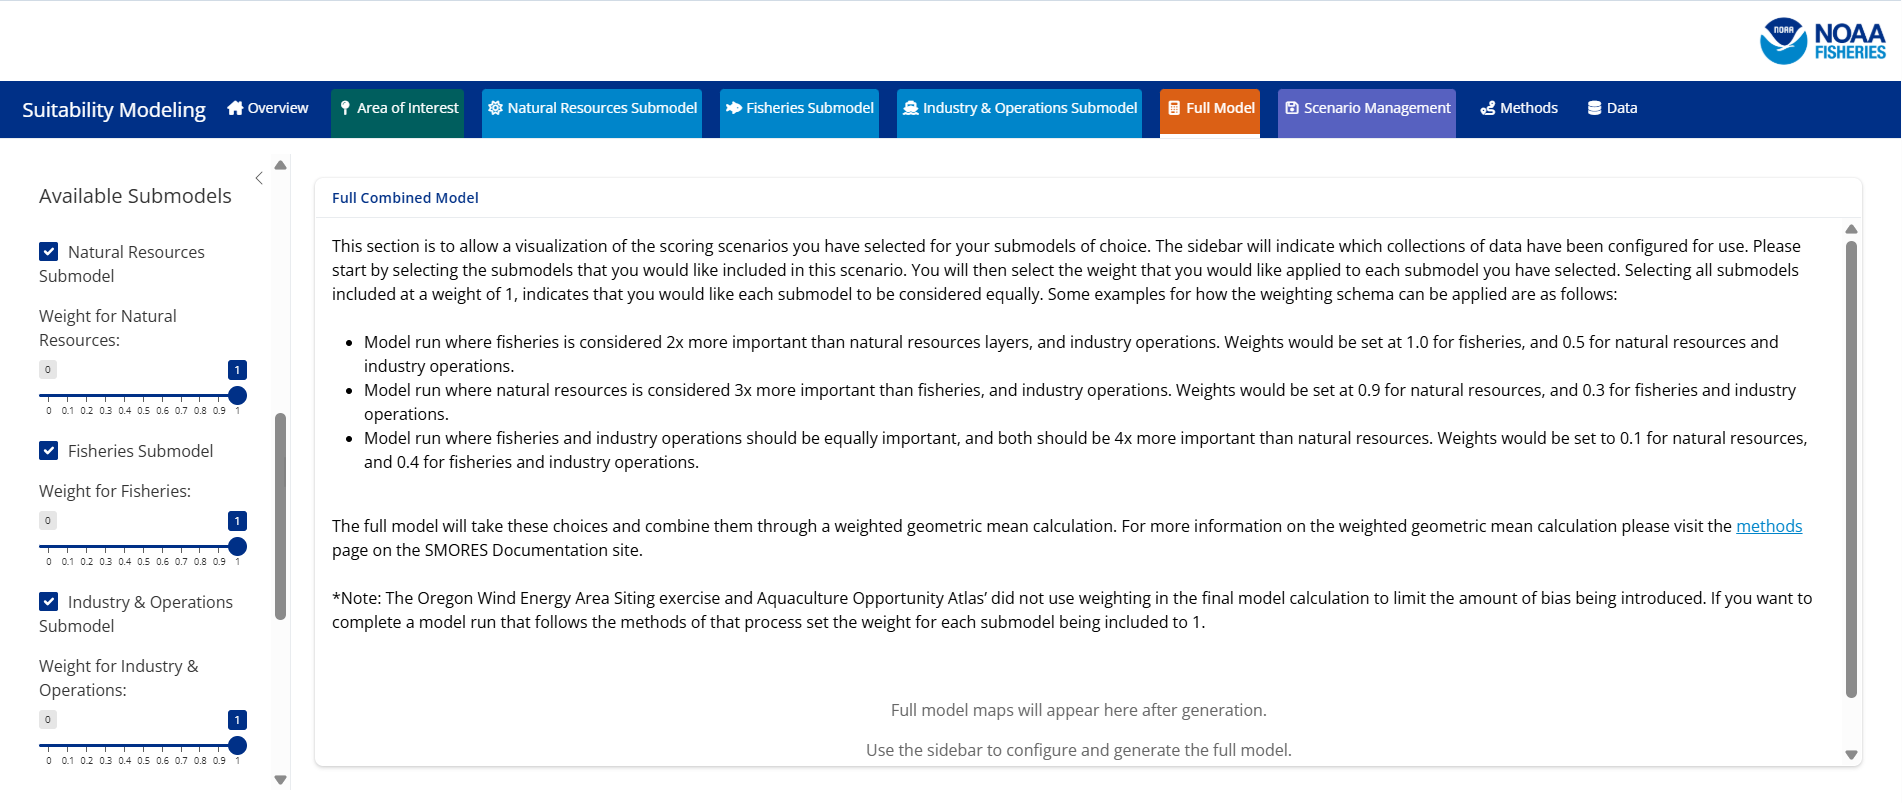
Once you have configured your submodels, you will click on the Generate Full Model button, which will produce a full model map.
You can opt to export a copy of your results by selecting the Export button at the bottom of the page. The report will be a HTML based report.